Specialized Section
HOW TO CHOOSE A DISK ARRAY – CHAPTER 5
02.12.2015, 10:24
What is more efficient – RAID 5 OR RAID 10? It looks like a seemingly simple question with a pandering answer ‘RAID 10’. Nevertheless the situation shall not be simplified and the performance potential of RAID 10 does not always have to show itself compared to RAID 5.
The performance of a disk system is defined by IOPs or number of Input/Output operations per second. One demand on reading or one demand on recording/writing equals 1 IO. Each disk used in a disk array has a certain performance potential depending on the speed of rotation and the speed of disk heads seek. Concerning SSD disks it depends on the construction of SSD units’ controller and its ability to realize complicated operations allied to reallocation processes and deleting of vitiated pages.
The controllers recast the performance potential of disks at the back-end (i.e. connectivity between controllers and disks) into performance potential at the front-end (i.e. connectivity between servers and controllers). It is a well known fact that different types of RAID and the parity calculations load the controllers.
Another fact is that RAID systems have different characteristics of reading and different characteristics of writing. It is caused by the necessity of parity storing or data mirroring. This attribute is called ‘RAID Write Penalty’.
RAID WRITE PENALTY – How to Understand This Attribute?
Let’s assume a RAID system with 8 2,5” disks 600 GB 10 krpm. All below mentioned testing was done on a Hitachi HUS 130 disk array, which is one of the best in its category.
Performance limits of the controllers are not put into effect and the measuring represent only the disk limits. The testing was performed by SQLIO.

RAID 10
Raid 10 is a combination of mirror and stripe (simultaneous writing in stripes). Hard disks are organized in pairs and inside of each disk pair the data are mirrored. If there is hard disk blackout, the data copy from mirrored disk is used.
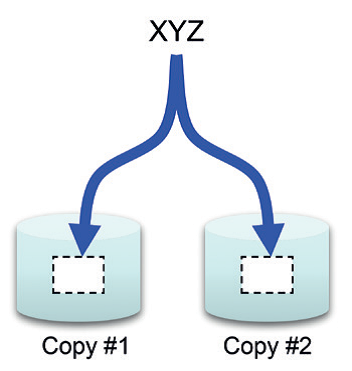
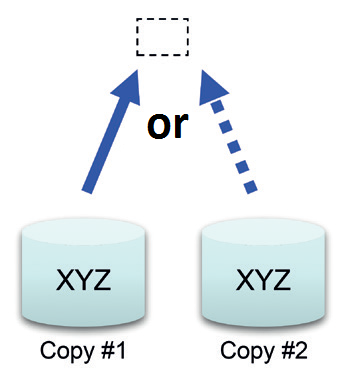
The chosen testing configuration RAID 10 has 8 disks and it is organized as 4+4. The RAID 10 calculations are very simple – the data are simply saved twice and there’s no need to calculate some complicated parity system. But it is not that easy concerning capacity efficiency; there’s a need for double capacity on disks to gain the required capacity. But we are interested in the aspect of performance.
From the reading view the data from all eight disks are read during one step. The efficiency of reading will be 8x performance of our one disk (2,5“ SAS – ca. 180-240 IOPs). The measuring performed with SQLIO stress test showed 1760 IOPs. There is a whole different situation for writing. The controller stores primary data into a half of disks (four disks in this case) and it writes its copy into the other half. The performance for writing will be 4x performance of one disk.
In case of RAID 10 the reading is twice faster than writing. And this attribute is related to RAID Write Penalty. In this case the Write Penalty equals 2. In our case the write performance was measured 1096 IOPs.
Workload RAID 10 Performance Random Read, 8kB Block 4+4 1760 IOPs Random Write, 8kB Block 4+4 1096 IOPs
RAID 5
RAID 5 is a combination of simultaneous write in stripes (stripe) and parity calculating. The value of parity is calculated via logic operand XOR from data disks. The parity is from performance reasons distributed through all disks and it is used for data reconstruction in case of disk blackout. It is very simple – the value of parity is used and an XOR operation with the data disks that have remained is performed and so the data, which were on the flawed disk, are reconstructed.
To gain relevant comparison we are going to use RAID group with 8 disks in this case too. In case of RAID 5 it is going to be organized as 7+1.
From the point of reading RAID 5 engages all disks – likewise RAID 10. The performance potential is also alike.
The situation of writing is diametrically different. The controller must take the following steps:
1) Read the original data
2) Read the parity
3) Write new data
4) Write new parity
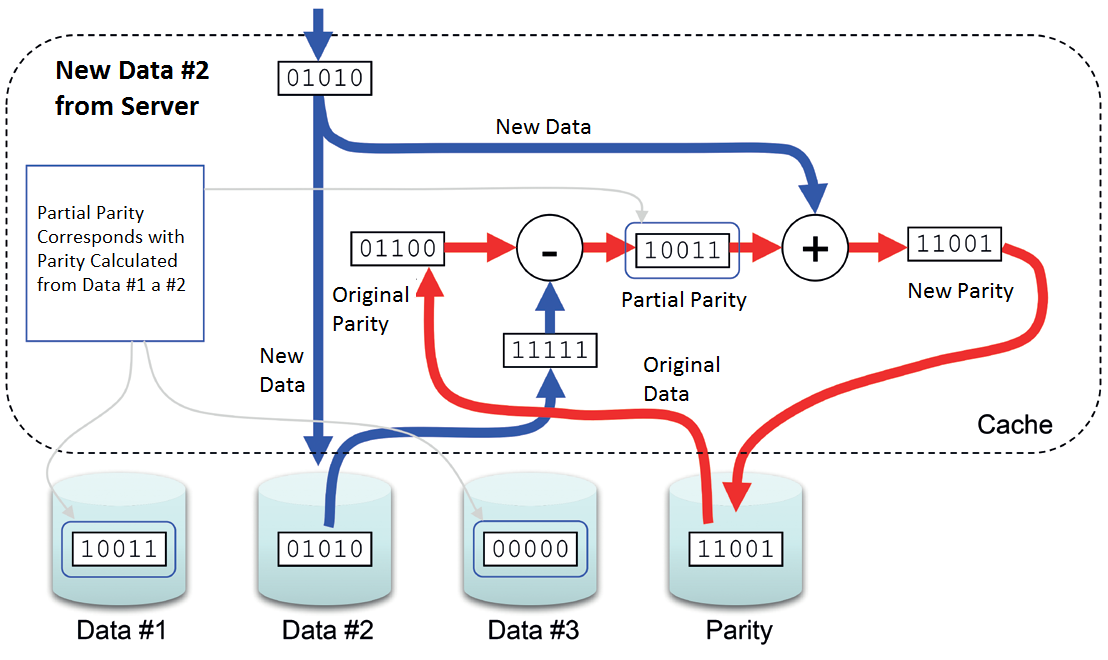
Write Penalty is 4 in this case. It is twice as more as RAID 10 and also the reason why RAID 5 is not ideal for running with dominant random write.
There was measured 1710 IOPs for reading. The writing loaded with RAID Penalty of 4 reached the performance of 489 IOPs.
Workload RAID 5 Performance Random Read, 8kB Block 7+1 1710 IOPs
Random Write, 8kB Block 7+1 489 IOPs
Let’s take a look at the measured data from the sight of a real analysis of the internal operations in a HITACHI HUS 130 disk array.
This disk system allows observing the performance ratios at hundreds of perimeters inside of its architecture. That way we’ve got the possibility to analyze all processes that happen inside of the disk array controllers. For now it is enough to display the operation at the front-end (IOPs at the ports of disk array) and the operation at the back-end (IOPs on disks).
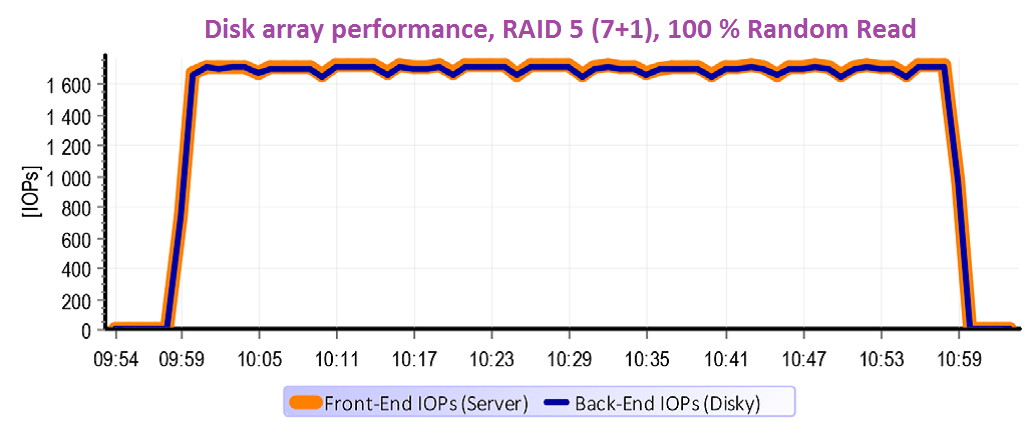
This graph represents the characteristics of RAID 5 for reading. We have not eased anything for the disk array. We have tested 100 % random operations at the capacity of 2 x 500 GB. The testing capacity reached over the disk array cache (32 GB) many times and that’s why the cache basically has not been applied. In other words – for everything, what the server wanted to read, the controller had to go to the disks. The front-end operation turned over to back-end 1:1.
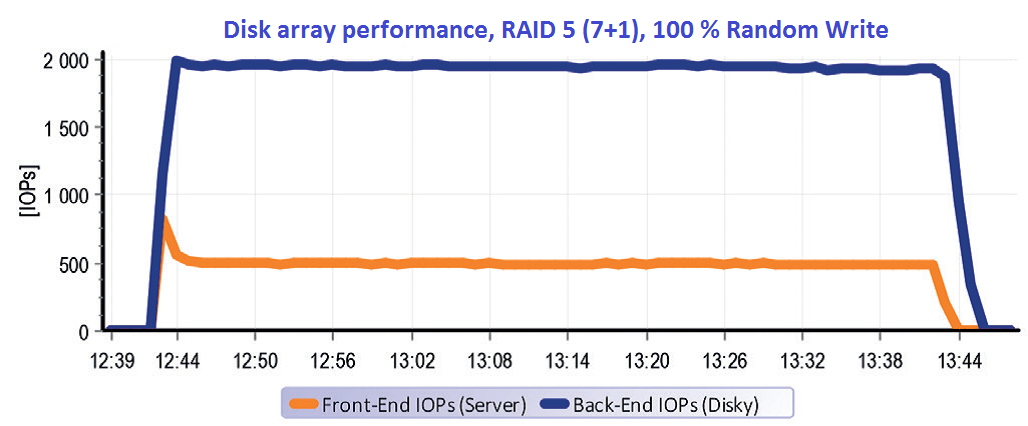
A whole other situation happens in case of writing with RAID 5. It is evident from the graph that the operation of servers at the rate ca. 500 IOPs caused an operation almost 2000 IOPs on the disks.
And it means Write Penalty=4. It is worth mentioning the few minutes of the test start where the performance peak caused by empty cache, which accepts the first minute of operation very quickly. Then the cache gets full and in regard of character of random operations the performance does not accelerate and the data only flow through it. At the ending of the test it is clear that the operation on disks lasts even after termination of running on servers – destage cache.
RAID 6
RAID 6 is an extension of parity system RAID 5 about another parity stream. Itsdevelopment required the coming of high-capacity SATA and NL-SAS disks. In case of blackout of these disks the parity reconstruction requires a couple of days. In case of RAID 5 during this time the disk group would be without security and the fall down of another disk means data loss. That is why the RAID 5 was supplied with another parity stream so the disk group would be resistant to fall out of even two disks at one point.
Let’s go back to our RAID group compound of 8 disks. In case of RAID 6 it will be organized as 6+2. From the point of reading it is not different a lot, the controller can reach for the data to all disks at once again and the reading performance is similar to RAID 5.
But in case of writing we have another two operations compared to RAID 5. It is necessary to read the other parity stream and also to save it. Write Penalty for RAID 6 equals 6.
The impact on write performance is huge of course and that is why it makes sense to use RAID 6 only there, where it has a purpose – i.e. for safety of parity groups compound of capacity disks.
Workload RAID 6 Performance
Random Read, 8kB Block 6+2 1472 IOPs
Random Write, 8kB Block 6+2 255 IOPs
WILL THE RAID PENALTY BE USED ALWAYS?
The producers of disk systems are aware of the fact that the RAID penalty causes a significant performance drawdown of write operations. That is why controllers’ algorithms are optimized so the penalty wouldn’t be used if it is only a bit possible.
For example if the server communicates with a disk array in sequential operations the logic of a disk array tries to compile the whole data block into cache. If it is successful the parity is calculated and the whole block is stored on disks at once without the necessity to deal with the original parity and original data and to read them from disks.
If the disk array firmware is written really well, another optimization is used. If it can tell that the server asks the disk array for sequential reading it prefetches another data into the cache. This technology is called read-ahead.
If the disk array can tell a sequential write it does not store instantly but it tries to compile one big block from the coming small ones and it sends the big one into disks.
In case of sequential operations an interesting effect happens. Whereas there may be a storm of tens of thousands IOPs on ports, between controllers and disks may be only few thousands. It is eloquently illustrated on practical measuring.
Let’s go back to our RAID 5 compound of 8 SAS 2,5” disks 600 GB 10 krpm. The performance potential for random operations was measured and it made 2000 IOPs for reading and roughly quarter for writing. But what happens if we do a ‘little’ change – what if we change the setting of the testing program SQLIO from random to sequential operations?
The graph shows how firmware of the disk array optimizes the processing of sequential operations. Small sequential blocks sent by server are compiled into large blocks in cache. A much smaller amount of that much bigger IOPs leaves to disks. In the above stated case was measured 50 000 IOPs at the front-end whereas the operation on disks was only 2 000 IOPs.
A TEST WITH 200 DISKS
A question was asked at the beginning what was faster – RAID 5 or RAID 10. The question remained unanswered because there is no universal answer – it always depends on the character of workload that is planned for the given group. In our test there were used 25 groups of disks organized in the first case as RAID 10 (4+4) and in the second case as RAID 5 (7+1).
A stress test was performed using the tool SQLIO on 25 competing streams. To respect the real behaviour of apps the test was performed on 8 kB blocks for random operations and on 64 kB blocks for sequential operations.
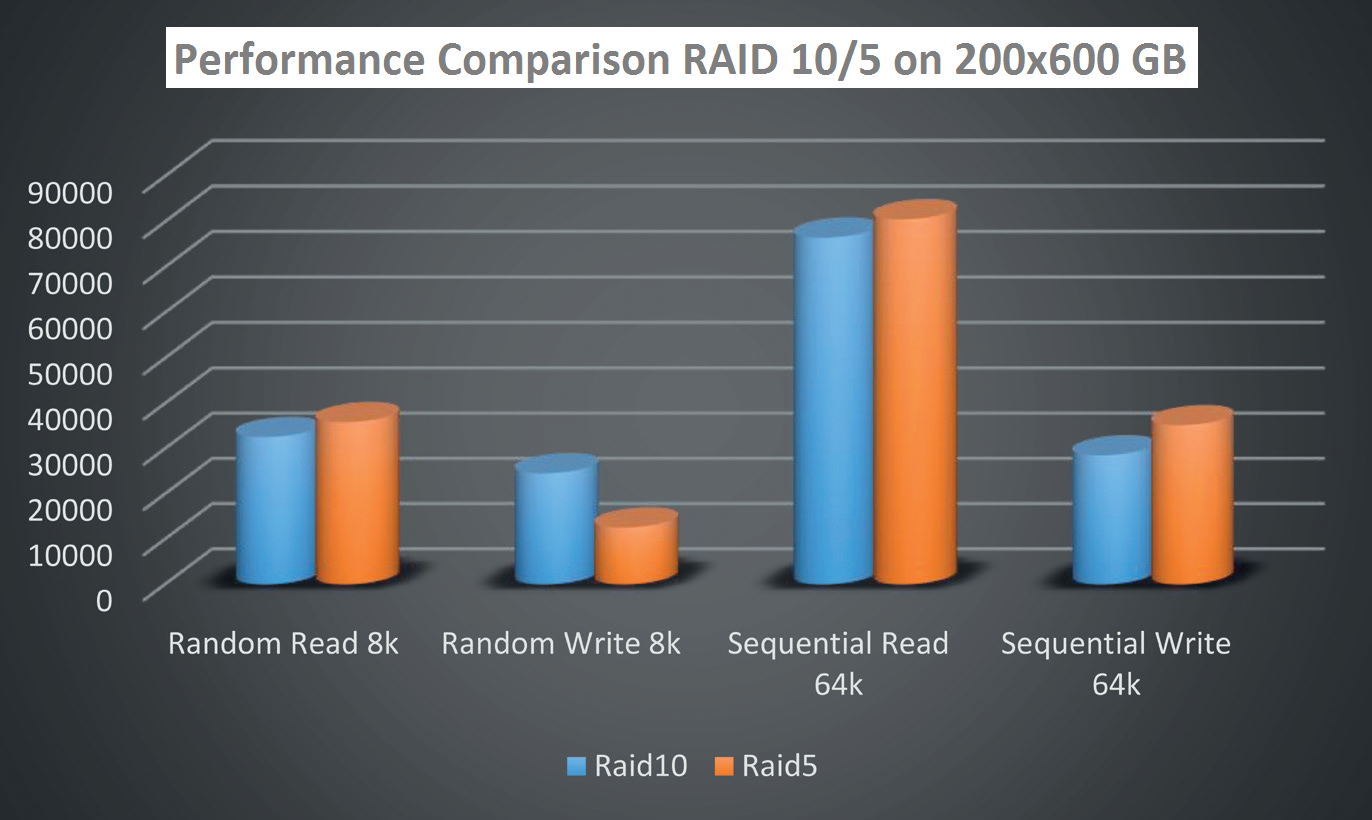
The measured results showed that the strongest aspect of RAID 10 is the write during random operations. And RAID 5 is an ideal parity system for sequential operations.
That is why the producers of databases such as Microsoft recommend the configuration of disk devices in its ‘Best Practices’ for SQL. The principle of the idea it the separation of database operation (which typically communicates in random small blocks) and redo log of operation (which typically communicates in large write blocks).
From the graph above it is more than plain enough that RAID 10 is ideal for databases and RAID 5 is ideal for redo logs. The separation of databases and logs has another positive impact – two completely different types of operation do not meddle above one LUN. The cache algorithms are more efficiently able to adjust and this aspect has a positive impact on performance.
AND THE CONCLUSION?
Our model case with 8 SAS disks had the performance potential from hundreds to thousands of transactions for random operations. The exact number depends on type of RAID and on the fact if it is reading or writing. In comparison with that the sequential reading or writing can efficiently accelerate the disk array algorithm and the differences are (compared to random operation) hundreds or thousands of percent. Here I would like to go back to the practical page of disk array choice from the submitter view. As it was proven it is possible to gain basically any result in case of one configuration by setting the test parameters.
If the submitter does not want to be disappointed with operating product characteristics they chose, these important steps should be considered:
1) To lay down the requirements on the future system with the analysis of the current environment.
2) In the appropriate manner to determine the types of RAID while respecting the best practices of producers of the planned applications.
3) To consider if some form of acceleration with SSD disks (Tiering, Fast Cache) is going to meet the expectations and if the significant impact on price is going to pay off.
4) To define the tool that is going to be used for accepting performance test and to define the test parameters.
Even though the individual steps sound very easily, a relatively deep analysis is behind them. And to perform such an analysis it is necessary to have an extensive know-how in the field of storage performance.
Only the first step, i.e. analysis of the current environment represents a complicated task for storage architect – they have to consider the measured data correctly. The number of transactions that have been defined by monitoring may be caused by two reasons. The first one – the app does not generate more transactions. The other possibility is that the current storage device has a performance limit and it just does not ‘let’ more. This consideration is possible on the basis of latency analyses and queue length and it requires a reasonable amount of experience.
Also the consideration of suitability of SSD acceleration is a chapter, which requires know-how. A seller who does not have this kind of knowledge may be recognised by declamation of simplifying marketing shortcuts without understanding the problem substance. The efficiency of SSD acceleration, which can put the potential of different media (SSD, SAS, NL-SAS) together, is always proportional to the changeability of data.
If there are data in the volume of stored data that are used often and on the contrary there are also ‘sleeping’ data, then even a little amount of SSD capacity will significantly improve the performance because the disk array can tell the often used blocks of data from other and it puts them on the fastest device.
Nevertheless there are also situations and applications that approach all stored data approximately equally often. In other words there are no so called ‘Hot Data’ that may be privileged by storing on SSD. In these cases the SSD disks bring only a small increase of performance and big surprise at the amount of investment.
The consideration of fitness and configuration of a disk array in a way that meets the expectations is not a completely simple task and it requires specialists.
